See the Full Picture
with Smarter Contact Center Reporting
Power Your Conversations with Contact Center Reporting
What is Contact Center Reporting?
Contact center reporting tools that help you categorize, track, and understand customer insights
Inadequate contact center reporting tools lead to gaps in operational efficiency and agent performance; allowing customer pain points to slip through the cracks. Unlock deeper visibility into agent behavior, customer trends, and communication channel performance with powerful visual engagement reporting that drives smarter, data-backed business decisions.
Grypp’s contact center reporting tools provide unparalleled insight into customer interactions. With built-in analytics and session tagging you can accurately track every conversation across all visual touchpoints, including video calls, co-browsing, screensharing, messaging, document uploads, and concierge services.
Gain access to valuable data without the heavy lifting of complex integrations. Use these insights to significantly improve quality assurance, support continuous improvement initiatives, enhance KPI analysis, and empower more informed strategic decision-making.
Grypp Tagging & Reporting
Label and categorize visual sessions with tags by topic, resolution, sentiment, or channel
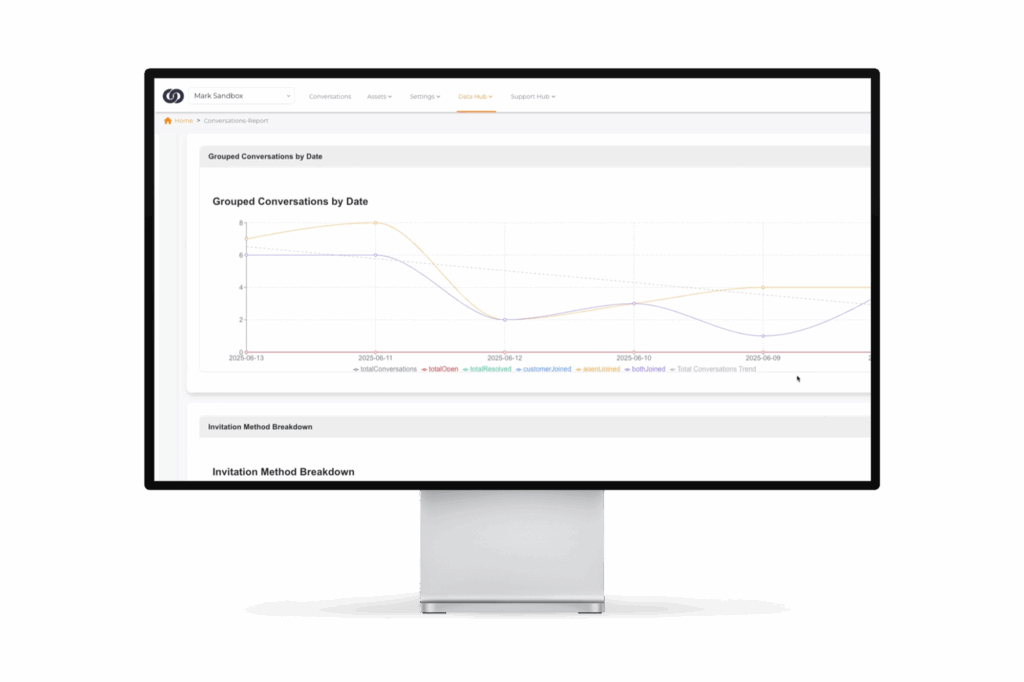
Real-Time Dashboards
Monitor contact center performance data across agents, teams, features, and time
Custom Filters & Exports
Create targeted views or shareable reports to measure volume by tag, agent handling specific issues, or regional trends
Unlock Real-Time Reporting to Power Smarter Strategic Decision-Making
Gypp’s lightweight CRM-style visual engagement reporting allows you to manage, track, and understand your contact center performance data in real time, to optimize operations and improve your bottom line.
Enhance Operational Visibility
- Track visual support activity by type and outcome
- Understand which capabilities influence or drive resolutions
Improve Agent Performance
- Tie feedback and tagging to individual agents
- Identify coaching needs and best-practice sessions for process improvement
Increase Data-Driven Decisions
- Spot bottlenecks or channel drop-off points
- Optimize workflows based on visual journey insights
Support Compliance & Audits
- Full session-level audit trails
- Filter by timestamp, customer, or tag

How Grypp Contact Center Reporting Works
Organize, analyze, and understand your customer interaction data to identify key business drivers and 36x your ROI.
Grypp’s contact center reporting tools enable your agents to tag every visual session manually or via automated triggers. Lightweight and easy to use, the session metadata from each customer interaction is collected automatically to aggregate data cross tags, agents, and verticals in customizable dashboard views. Agents can easily export data to analyze further or set alerts for certain outcomes – so that you can uncover common themes and pain points across your customer base in real time.
Grypp is powerful on its own but integrating it with your existing software is fast and hassle-free. Our public API makes it easy to embed visual interactions directly into your existing solutions. Plus, built-in reporting tools give you real-time insights into usage, performance, and customer outcomes, so you can continuously optimize your support experience.
See the Results
Reduction in AHT by identifying where agents spend the most time during interactions.
Increase in CSAT by reducing friction for form fills, tech issues, or billing through showing real human presence
Boost in conversions via guided product comparisons, custom basket builds, and visual upsell/cross-sell opportunities at checkout
Reduction in non-technical fault returns through accurate issue triage and live system walkthroughs
Reduction in service engineers booked in error through virtual visual diagnosis and step-by-step coaching

Why Grypp?
Grypp’s contact center reporting tools deliver immediate visibility into every customer interaction – enabling you to understand agent performance and surface common themes and pain points across your customer base in real time.
- Categorize by tags built into live agent workflows
- Utilize powerful data visualization, tailored for contact center leaders
- Integrate feedback, ratings, session metadata, and timestamps
- Export dashboards and custom reporting views
- Use seamlessly in multi-capability session environments such as, docs, video, and chat
- Perfect for internal teams or white-labeled for BPO clients
Visual Engagement Reporting Tools to Uncover Business Drivers, Analyze Customer Trends & Boost Operational Efficiency
Tagging
- Tag each conversation to identify key drivers including billing issues, fraud, cancellations, or technical support
- Surface common themes and pain points across your customer base in real time
- Augment your performance reviews by seeing how many conversations relate to specific challenges or resolutions
- Utilize data for coaching, QA reviews, and process improvements
- Build reporting views to measure volume by tag, agent handling specific issues, or regional trends
- Instantly search and filter historical conversations by category or issue type
- Improve handovers by giving context to managers or second-line agents
Real-Time Dashboards
- Instantly reflect the latest conversations, tool usage, and activity
- View live metrics across multiple tenants
- Drill into active sessions, open cases, or tagged issue types in real time
- Monitor agent performance and engagement at a glance
- Surface immediate trends like spike in cancellations or fraud tags
Custom Filters & Exports
- Save personalized views per user for rapid insights
- Export filtered datasets for offline analysis or presentations
- Quickly download raw data to support QA reviews, coaching, or reporting
Contact Center Reporting for Every Industry
Understand key customer and agent metrics with visual engagement reporting that benefits every industry
Automotive
Enhance customer service and vehicle reliability through highlighting of recurring support issues
Finance
Monitor onboarding session completion rates with customer interaction analytics
Healthcare
Conduct compliant QA reviews of sensitive document handling from patient insights and analytics
Insurance
Understand trends in visual claims assessment efficiency through customizable reporting views
Property Management
Track and prioritize maintenance trends to reveal common tenant issues and help better allocate resources to prevent recurring problems
Retail
Reveal how visual support drives conversions by category – so you can focus resources where they deliver the most sales impact
Technology & SaaS
Optimize product and support performance by identifying frequent user challenges and feature adoption to help improve UX, onboarding, and support processes
Travel & Hospitality
Improve service quality through issue trend analysis by uncovering patterns in guest complaints or requests
Utilities
Uncover channel performance trends to optimize customer journeys and lower support costs
FAQs
What types of data can be tagged and tracked?
All customer and agent data that flows through your contact center from visual touchpoints such as video, docs, messaging, web navigation, screen sharing, uploads, and concierge can be tagged and tracked using Grypp’s customer interaction analytics tools.
Can reporting connect to feedback scores and agent data?
Yes, reporting connects to feedback scores and agent data. Grypp’s contact center reporting tools are perfect for performance reviews and offer data for agent coaching, QA reviews, and process improvements.
Are dashboards customizable by role or team?
Yes. Dashboards in Grypp are fully user customizable. Each team member can build and configure their own dashboard layout based on personal preferences and workflow needs. Customizations are saved locally per user, ensuring an independent and tailored experience without affecting others on the team.
Can I filter reports by customer journey or interaction type?
Yes, reports can be filtered by customer journey or interaction type and outcome, and workflows can be optimized based on visual journey insights.
Can tags be applied automatically based on session behavior or agent input?
Yes, tags can be applied automatically to each session based on automated triggers as well as manual agent input.
How can reporting insights be used to improve agent coaching and workflow optimization?
Reporting insights allow you to see how many conversations relate to specific challenges or resolutions, and surface common themes and pain points across your customer base in real time. These analytics can be tagged and tracked to understand and improve agent coaching and optimize workflows.
Is it possible to track conversion rates for specific visual tools (e.g., website, video + document)?
Yes, Grypp’s contact center reporting tools allow you to track conversion rates from all Grypp visual engagement tools, such as website co-browsing, video calls, screen sharing, docs, messaging, experience ratings & surveys, uploads, and concierge.
Can reports be exported for external BI tools or client reporting (for BPOs)?
Yes, reports can be exported via dashboards and custom reporting views for use in external BI tools or other client reporting tools.